Scan Dashboard
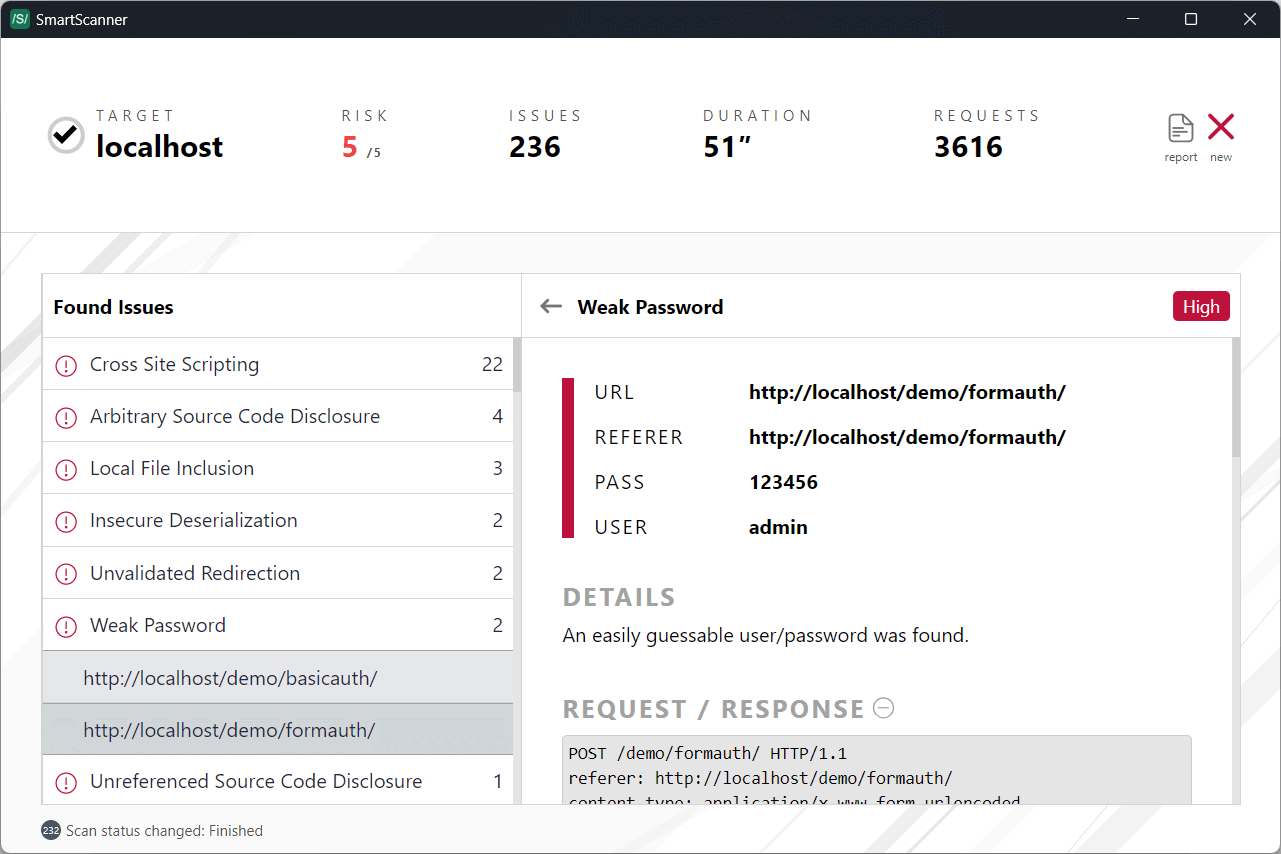
Upon initiating a scan, SmartScanner displays the scan dashboard, providing a comprehensive overview of the scanning process. Below is a breakdown of the key sections of the scan dashboard:
Status Section
The top bar of the dashboard presents essential information regarding the ongoing scan:
- Target Information: Domain/IP address of the target and current scan status.
- Security Risk Score: Indicates the level of risk associated with the target based on identified issues, ranging from 0 to 5 (with 5 representing the highest risk).
- Unique Issues: Number of distinct security issues detected.
- Scan Duration: Time elapsed since the start of the scan.
- Network Requests: Total number of network requests sent during the scan. For detailed statistics, simply hover your mouse over the network requests section.
You can manage the scan using the controls provided in this section, including options to pause, resume, or stop the scan. Note that once a scan is stopped, it cannot be resumed.
Upon completion or termination of the scan, you can save the scan report using the report icon. Clicking the new scan icon clears the current scan results and returns you to the startup page.
Issue List
Located in the left panel, the issue list presents all identified security issues grouped by issue name. You can expand each group to view security issues sharing the same title. These issues correspond to items listed in the security vulnerability list. Clicking on any issue provides detailed information in the right panel.
Issue Details
The right panel displays specific details of the selected security issue. If no issue is selected, a pie chart illustrates the severity distribution of detected issues.
Each security issue includes attributes such as URL, severity level, and additional relevant details. For instance, in the provided image, the discovered User and Pass are highlighted. Additionally, you can access specific information and network request/response details related to the selected issue.
Descriptions and recommendations for addressing each issue are provided, assisting in the remediation process. Utilize this information to effectively mitigate identified vulnerabilities.